Understanding Security State
Introduction
Ali wants to have actionable information. In this lab, you will make sure Ali has a quick way to find how his Applications are doing from security point of view. Ali wants to be comfortable while navigating the Dashboard so he knows what kind of information is readily available to him.
Use the credentials used previously to login to the AppDynamics controller if you’ve been logged out.
AppDynamics Application Dashboard
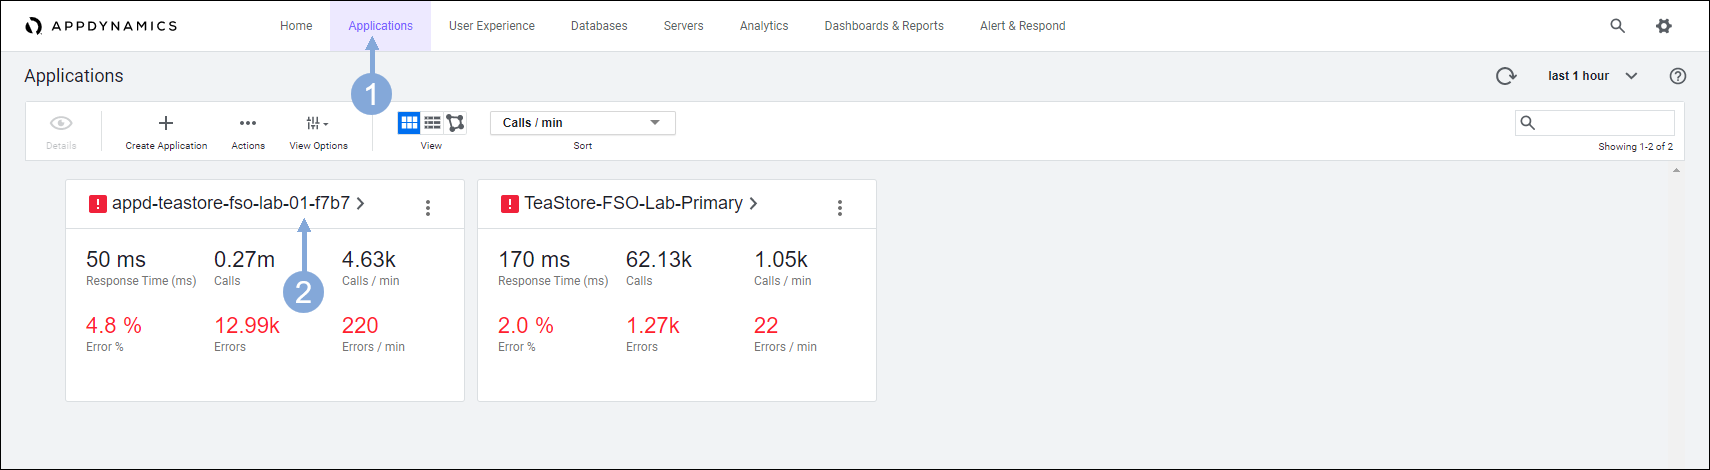
Use the steps below to navigate to your TeaStore application.
- Click on the Applications tab on the top menu
- Find your TeaStore application with your lab number in the name and click on its name to open it
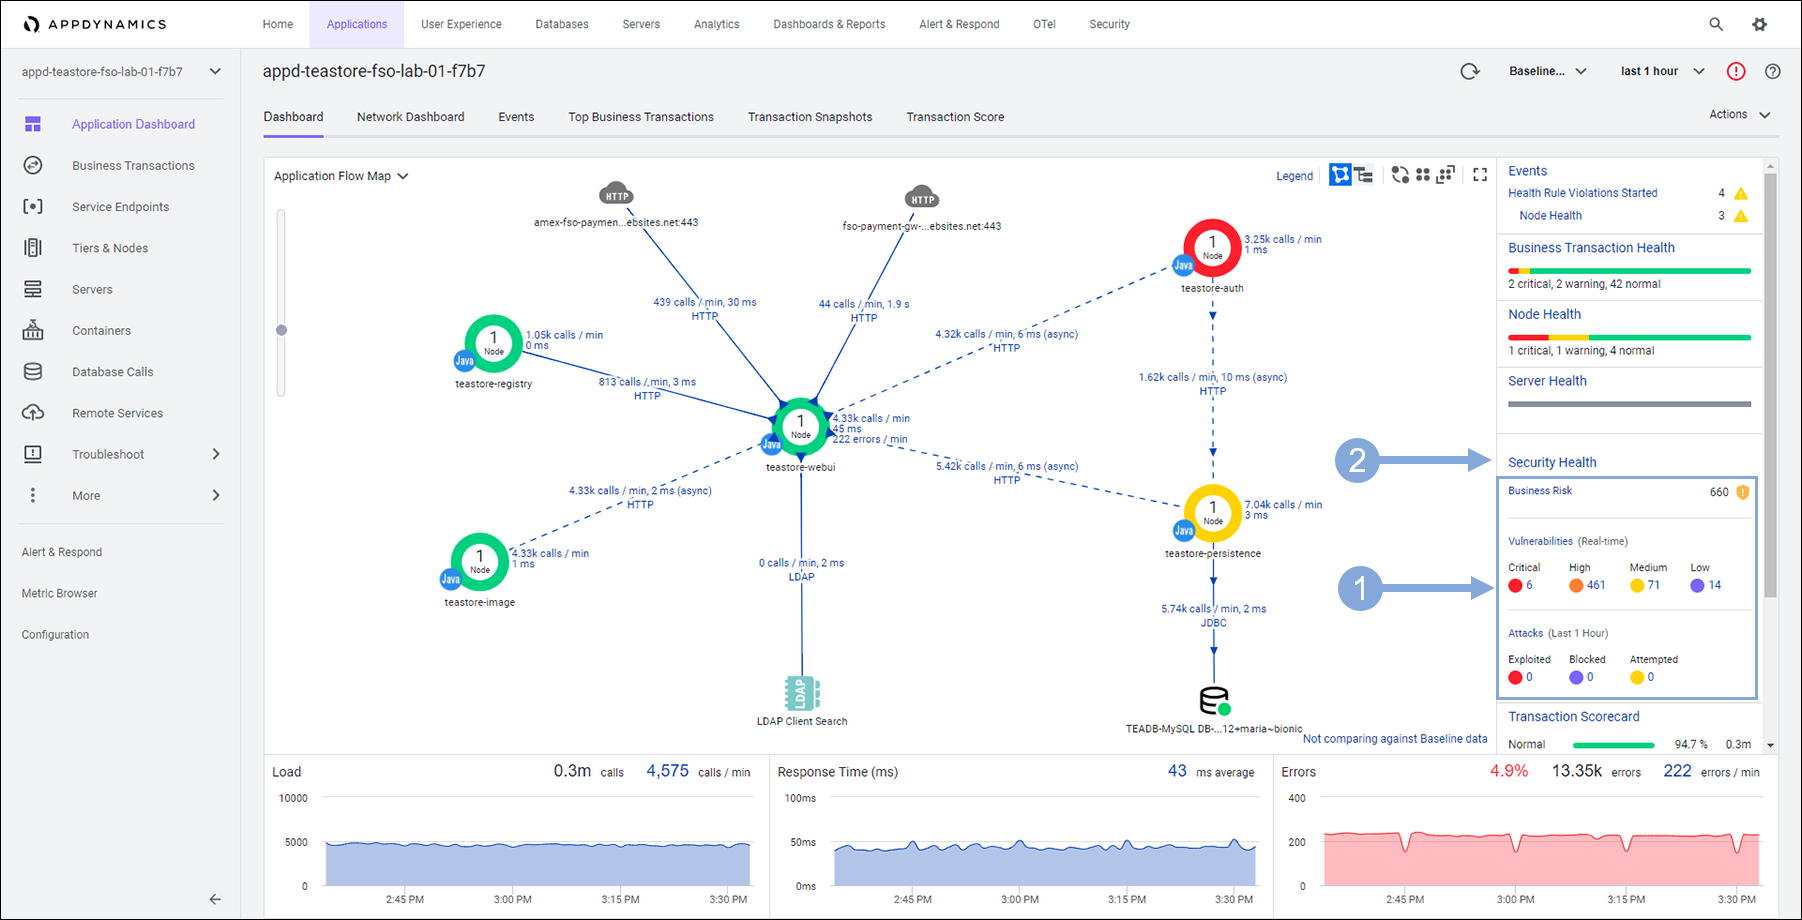
The Application Dashboard displays showing the components that comprise the TeaStore application.
- The Security Health widget shows us if we have any Critical or Warning events
- Click on the Security Health link to launch the Secure Application dashboard
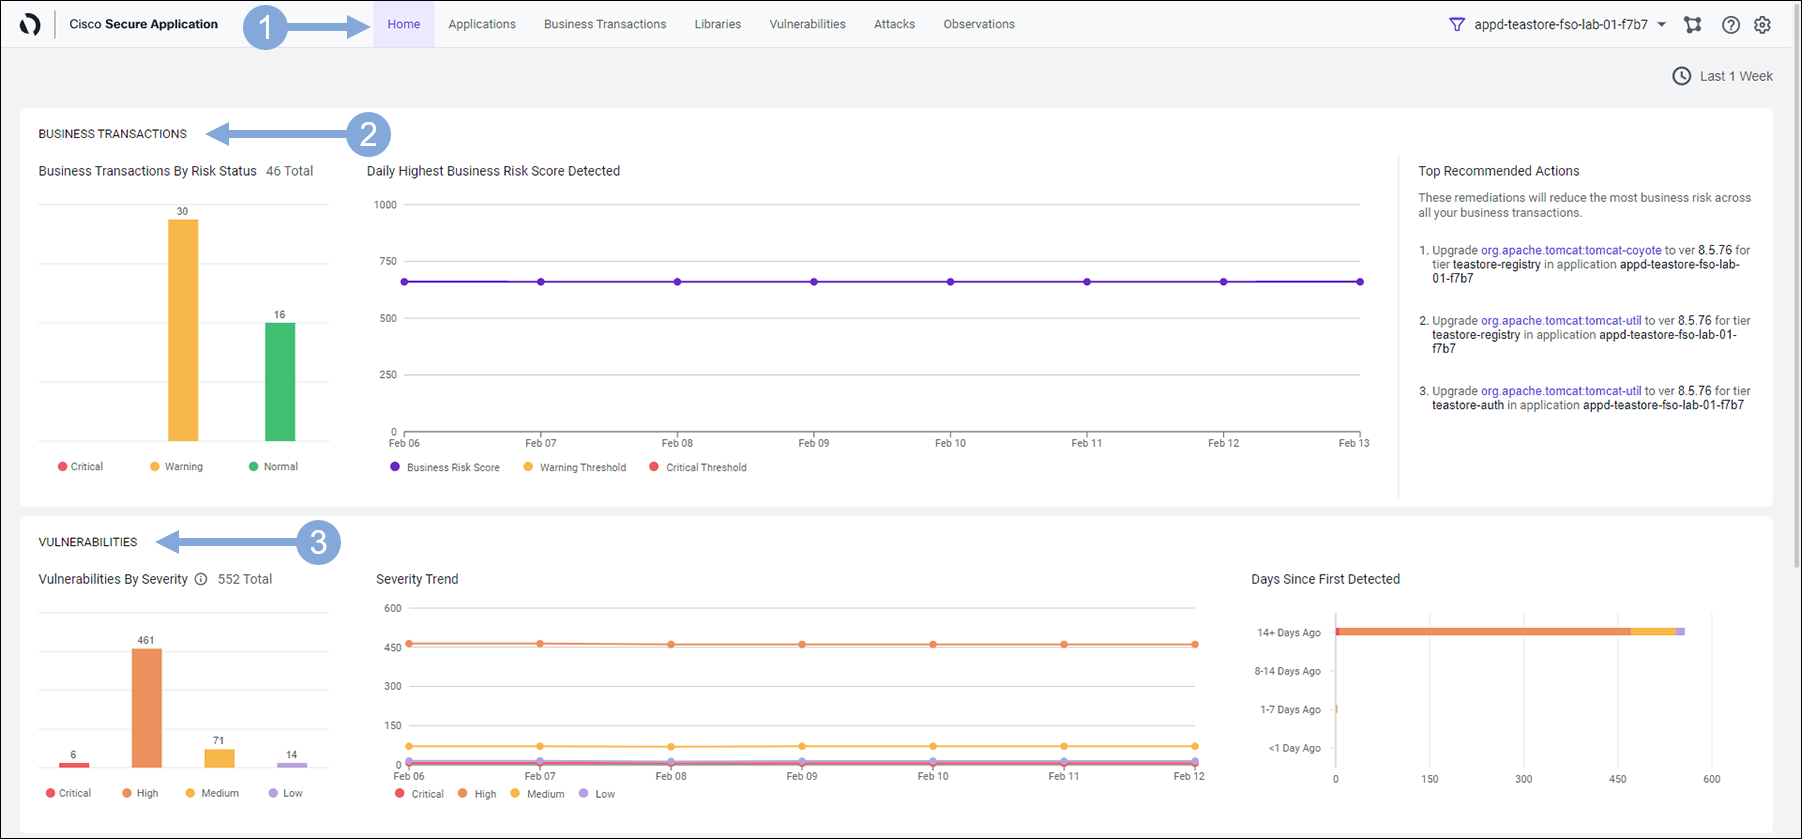
CSA Home Dashboard
The Home page provides a high-level overview of Attacks and Vulnerabilities of the monitored application.
Navigate to the Home page by clicking the Home tab on the top menu
The Business Transactions pane shows the number of business transactions based on their risk score detected along with the Top Recommended Actions
The Vulnerabilities pane shows the number of both Open and Fixed vulnerabilities.
- The chart in the left represents the total number of vulnerabilities based on their risk score.
- The color of the chart displays the number of vulnerabilities for different severity levels:
- Critical = Red High = Orange Medium = Yellow Low = Purple
- Days Since First Detected shows the number of days the vulnerability has been open for and it’s severity
- Severity Trend shows the trend of fixing the open vulnerabilities
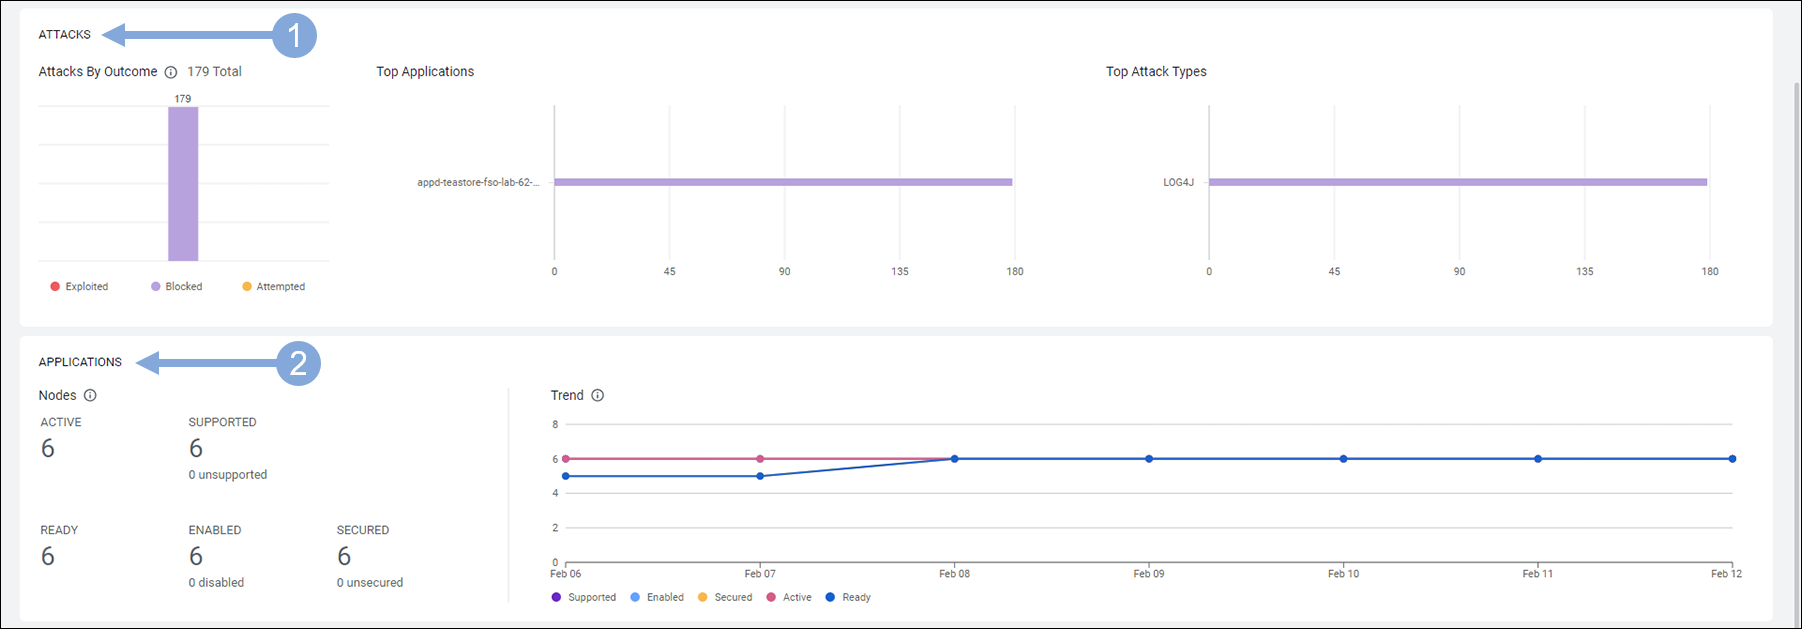
Scroll down the screen to see the Attacks and Applications pane.
The Attacks pane displays the number of Attacks by Outcome, Top Applications and Top Attack Types.
- The chart on the left shows the total number of Open attacks and their states:
- Exploited = Red Blocked = Purple Attempted = Yellow
- Top Attack Types displays the top 10 attack events in different states (exploited, blocked or attempted)
- The chart on the left shows the total number of Open attacks and their states:
The Applications pane displays the nodes of the application in question and the trend
- Total Active Nodes Total number of APM nodes that are registered and active in the AppDynamics controller.
- Supported Nodes Number of Active nodes that are running a Secure Application supported version of the agent.
- Ready Nodes Number of Supported nodes that are sending heartbeats to the Secure Application service.
- Enabled Nodes Number of Ready nodes that have a Security Setting value of Enable.
- Secured Nodes Number of Enabled nodes that are sending security insights to the Secure Application service.
Summary
Just by looking at the Home page of his Secure Application Dashboard, Ali has not only learned about his application and it’s security state but he also has actionable information.
- Number of Open Vulnerabilities, their severity levels and the lifespan of those open vulnerabilities
- Open attacks that needs to be fixed and their states
- Top Applications with open attacks and event types
- Nodes of the application(s) that needs to be enabled and secured
Next
We’ll look at how Cisco Secure Application easily enables Attack Detection and Prevention for your business crititcal applications.